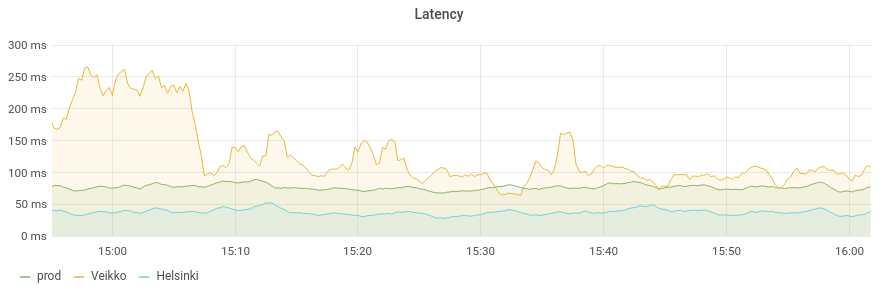
Ping metrics as graphs
I wanted to see latency graphs for my internet connection, as well as to some various servers/devices:
Why?
Having multiple ping targets gives you a pretty accurate view of the health of your internet connection, and also any networking issues for the target devices themselves.
If all the lines go up (latency increases), the problem is in your internet connection.
However, if only one target you’re monitoring starts to act up, you know the problem is elsewhere. Maybe the device itself went down, or lost network connectivity?
You can set up ping targets to many different places you care about, so you can set up alarms if they go down or just to have additional troubleshooting data (when did it go down etc.).
For example I am connected via Tailscale to multiple friends and family members' Raspberry Pi devices (they effectively get static IPs via Tailscale that just work™ regardless of any annoying NATs along the way).
How I did it
It was surprisingly easy.
I was fully prepared to crank out some code to ping and export measurements to Prometheus, but I was delighted to see that there was a ready-made Docker image for it!
I already had these set up:
- Prometheus for storing the time series data
- Grafana for displaying graphs
I needed to add:
- ping_exporter for pinging and exporting the metrics to Prometheus
First I created /persist/apps/ping_exporter/config.yml with something like this:
targets:
  - 100.114.89.43 # prod server
  - 1.1.1.1 # Helsinki (Cloudflare datacenter)

dns:
  refresh: 2m15s

ping:
  interval: 2s
  timeout: 3s
  history-size: 42
  payload-size: 120
Then I created Docker-compose configuration with something like this:
version: "3.5"
services:
  app:
    image: czerwonk/ping_exporter:v0.4.7
    environment:
      METRICS_ENDPOINT: :9427/metrics
    volumes:
    - type: bind
      source: /persist/apps/ping_exporter
      target: /config
The METRICS_ENDPOINT on any container’s metadata makes it so that ping_exporter gets automatically
“discovered” to Prometheus via promswarmconnect.
Done!

Thanks for reading! 😍
If you like my writing, consider following me on Twitter.
Stay updated on my blog posts & projects - sign up for
my newsletter. 🚀
No spam, unsubscribe any time.
RSS also available.